Scale of 5 Values and 7 Values
In this lesson we will begin to explore 5 values [primarily] and 7 values [secondarily]. In order for an object to feel 3 dimensional, the rendering of this object must contain at least 5 values. Leonardo DaVinci, a Renaissance painter, first coined the term Chiaroscuro. This term means to draw out of the darkness and reveal it in the light. This is the most important artistic theory in western culture and has influenced all works of art since its conception by Leonardo DaVinci. Chiaroscuro means light revealing something that was previously obscured by darkness. Creating a scale of 5 values allows us to shape the form of an object by shaping how the light falls on that object to reveal it 3-D form.
Assignment
Materials:
- 11 x 14 pad
- Pencils
- Pencil sharpener
- Gum eraser
- Drawing Board
- Ruler
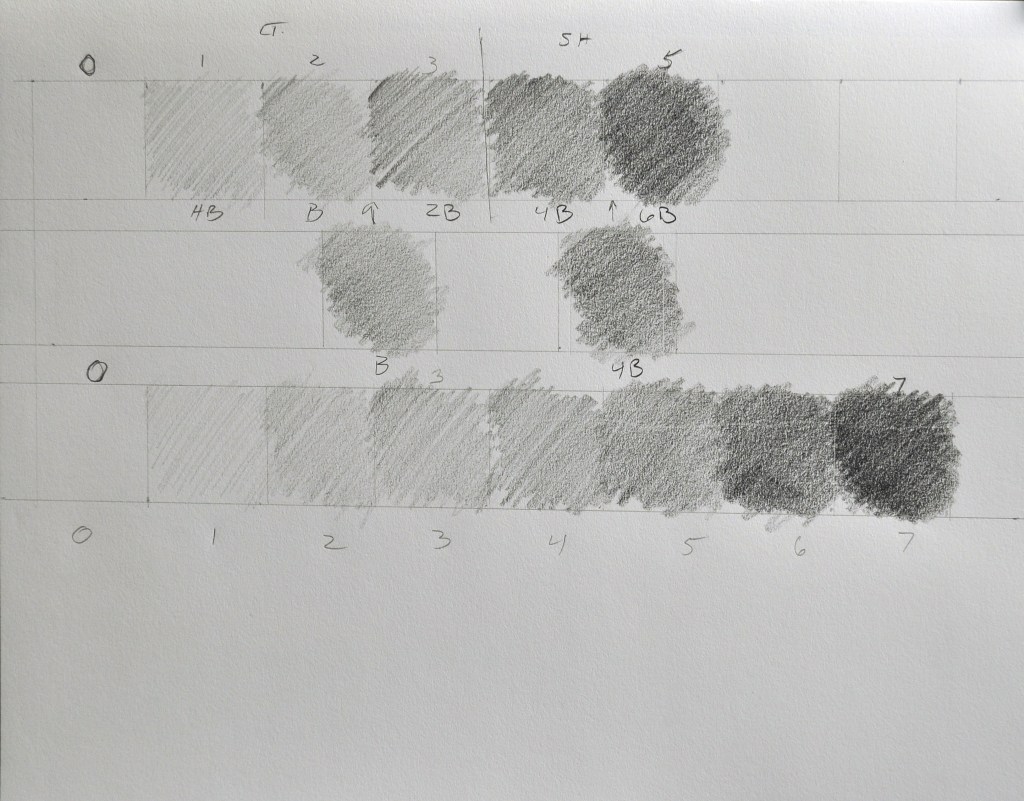
5 Value Chart:
- On the 11 x 14 pad held horizontally. Draw two 1.5″ x 1.5″ squares. Place one all the way to the left and one all the way to the right. The square to the left is value #0. Leave this blank. The square all the way to the right is value #5. Take your 6B pencil and fill in this square as dark as the pencil will allow. Do not make it shiny. Darken it only so far as the lead remains a flat tone.
- Next, place a 1.5″ x 1.5″ square in the middle between the black and white. Estimate this value as halfway between the two extremes. Fill this in with the 2B pencil. This is value #3.
- Next, place a 1.5″ x 1.5″ square between value #3 and value #5. Estimate this value as halfway between value #3 and value #5. Use your 4B pencil. This is value #4.
- Next, place 2 squares of 1.5″ x 1.5″ between value #0 and value #3. Estimate these two values. Use the HB pencil for value #1. Use B pencil for value #2.
- Examine these values to see if there is a visual sweep across the chart. If a value stands out, adjust that value correctly by lightening or darkening it.
7 Value Chart:
- Place a 1.5″ x 1.5″ square below and between value #4 and Value #5. Estimate its value as halfway between value #4 and value #5. Use the 4B pencil.
- Next, place a 1.5″ x 1.5″ square below and between value #2 and value #3. Estimate this value. Use the B pencil.
- Next, create a 7 value chart by bringing all these values down on a separate line. Create the 7 squares of 1.5 x 1.5 and fill in with the correct value from above. Examine these values to see if there is a visual sweep of values. If one stands out, adjust its value. Use the same pencils that you used to create that value.
Upload photo of this sheet of 5 Values and 7 Values.
T/TH, Due:
M/W, Due:
Secondly, Please watch video and answer questions for, “Mona Lisa Coffee”. T/TH, Due: ; M/W, Due:
